
Perceived Exposure: A Pilot Report
What young people in China expect AI to do to their jobs
The appendix carries the question wording, sample composition and cleaning rules, the full belief–behavior matrix, robustness checks, and the comparison surveys.
Key findings
- One in three young workers and graduating students in China puts the chance that AI eliminates their job within five years at 50% or higher, yet few expect the job to vanish.
- Workers who use AI at work every day expect it to raise their pay; graduating students expect to earn less and worry more.
- Two-thirds say AI has already changed the kind of job they are looking for, and they move in the direction their own pay expectations point.
- Almost everyone would take a free AI course, few would pay ¥800 for it, and the people who drop out first are those short of cash, not those most afraid.
- Workers’ replacement expectations move with how much AI already does in their own job, not with their occupation’s exposure score; students’ move with both.
Introduction
How AI reshapes the labor market depends on three things: what AI can do, how far firms and workers have taken it up, and what workers believe it will do to them. The first two are measured by exposure indices and by usage data such as Anthropic’s Economic Index. The third is measured least, and it matters because beliefs shape behavior before impacts arrive. A worker who wrongly believes her job is safe does not retrain. A graduate who wrongly believes a field is doomed does not enter it. Most of what is known about these beliefs comes from rich countries, from polls that ask for sentiment rather than probabilities, or from surveys of AI users.1
This report describes a pilot survey designed to reach the people those sources miss. In July 2026 I surveyed 500 graduating students and 500 workers, most of them under 35, through an online platform in China. I asked how much of their job AI already does and how much it could do in the near and far future. I asked what they expect to happen to the content of their work, their income, and their peace of mind. The survey also asked what they have done about it: whether they have changed the direction of their job search, and whether they would pay for training. It is a pilot, with the precision of 500 people per group and every behavior stated rather than observed. I present it as a template for a larger study rather than a set of final answers.
Who responded
Both questionnaires ran on Credamo, a Chinese online panel, in July 2026, with soft quotas on city tier, occupation, and education. Graduating students answered every job question about the occupation they are targeting; workers answered about their current job. After cleaning, the analysis sample is 496 students and 485 workers.
The sample is not a picture of China’s workforce. Compared with the 2020 census it has too many professionals and managers and too few farmers and factory workers. It is younger, more educated, and much more AI-savvy, with two-thirds of each sample using generative AI daily. Appendix B has the full composition, the cleaning rule, and a reweighting to the census.
1. One in three puts even odds on being replaced within five years, but few expect the job to vanish
I began with the plainest questions. How much of your job does AI already do? How many of its ten main tasks could AI do on its own in five years? What is the chance that AI replaces your job outright, so that no person is needed, within one, five, and ten years? And what will the job look like in five years?
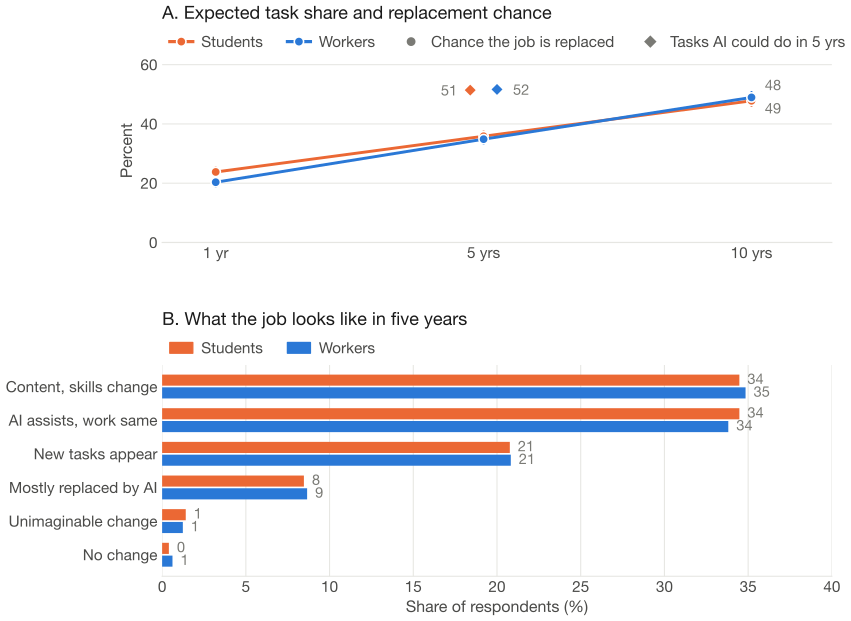
Exhibit 1: Young Chinese expect AI to do about half their tasks within five years, and expect the job to change rather than vanish. Panel A: mean stated percent chance that AI replaces one’s own job at one, five, and ten years, and the mean share of the job’s ten main tasks AI could do in five years (diamond), for students (orange) and workers (blue). Panel B: what respondents expect their job to look like in five years. Whiskers are 95% confidence intervals.
AI is already in the job. Half of each sample say AI already does a sizable part or most of their job’s tasks, and nearly half expect it to handle six or more of the ten main tasks within five years. The chance of outright replacement climbs with the horizon: about one in five within a year, one in three within five years, one in two within ten. A third of students and three in ten workers put the five-year chance at 50% or higher.2
Replacement, though, is not what most people picture. Asked what their job will most likely look like in five years, fewer than one in ten chose “mostly replaced by AI.” A third expect AI to assist while the work stays the same. A third expect the content and skills to change, and a fifth expect new tasks to appear. Students and workers agree on all of this.
These levels are high by Western standards but not by Chinese ones. Gallup found 18% of U.S. employees calling the elimination of their job within five years likely. Ipsos fielded the same five-year item in mainland China three months before this survey and found 52% calling replacement likely, double its U.S. figure. “Likely” is a looser category than “50% or higher,” so the pilot’s respondents are, if anything, less pessimistic than Ipsos’s. Appendix G lines up the comparable surveys. What the pilot adds is the shape behind the level: how the probability is distributed and how it sits beside the same person’s expectation of a job that changes rather than ends.
Understanding tempers expectations. I asked two test questions about how language models work. Workers who answered both correctly expect AI to take about one task fewer of their ten than workers who answered one or neither.3
2. Workers who use AI expect to gain; students expect to lose
Expecting AI to do half your job is not the same as expecting to be worse off. I asked what AI will do to the respondent’s own income over five years, from “down a lot” to “up a lot.” I also asked how worried they are, from “not at all” to “so worried it already affects my mood or my decisions.”
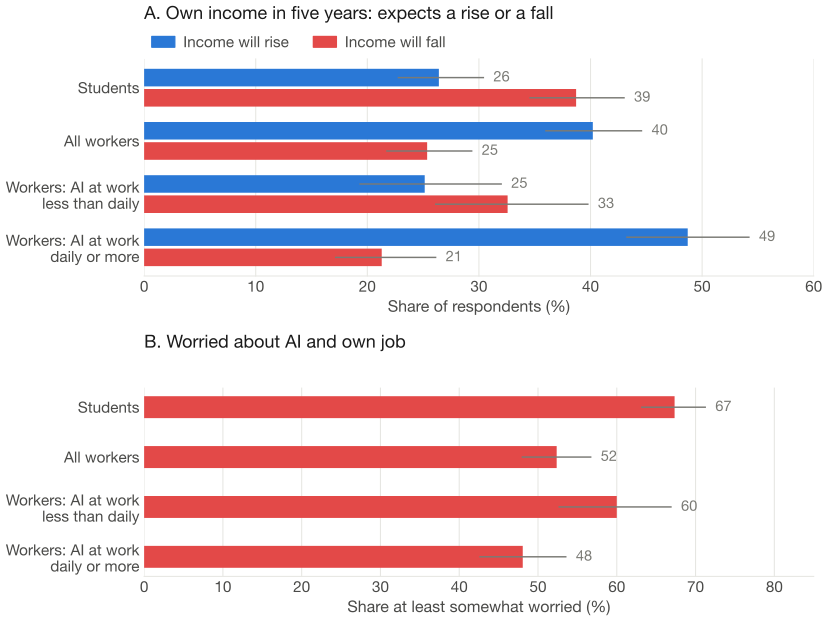
Exhibit 2: Workers who use AI at work daily expect a raise; students expect to earn less and worry more. Panel A: share expecting their own income in five years to rise (blue) or fall (red). Panel B: share at least somewhat worried about AI and their own job. Workers are split by whether they use AI at work daily. Whiskers are 95% confidence intervals.
Workers lean optimistic. Two in five expect AI to raise their pay and one in four expect it to lower it. The split follows use: workers who use AI at work every day are twice as likely as other workers to expect a raise from it. Three in four workers expect their overall wellbeing to improve. Anthropic reports the same pattern among its own users in Cadences, where the heaviest automators are the most optimistic about their pay, and the same caveat applies. People who have found AI useful are the ones using it every day, so the split describes selection as much as effect.
Graduating students lean the other way. More expect AI to lower their starting income than to raise it, and two in three are at least somewhat worried. This is not because students expect more replacement. Nor is it composition. The gaps in worry and expected income survive holding gender, education, cash on hand, AI use, and target occupation constant.4 It is that students are looking at the entry point. The one-sentence answers collected at the end of the survey say why. Workers mostly wrote about efficiency; students wrote about replacement, about the pressure to upskill, and about a higher bar for entry-level jobs.
AI handles the reports and the bookkeeping, the basic financial work, and cuts the repetitive tasks a great deal, so I have more energy for planning and risk control.
— Finance director
There are fewer entry-level positions that fit new graduates.
— Graduating student, targeting law
The gap between people about to enter the labor market and people already in it is the one Anthropic found among its users in its 81,000-person interview study. There, early-career respondents were the most likely to mention a threat to their job and the least likely to say AI had benefited them. It also matches a Chinese student survey in which four in ten worry that AI will replace their intended career.5
3. Two-thirds have already changed course, in the direction their pay expectations point
Beliefs matter for the economy because they move what people do. The survey asked whether AI has changed the kind of job the respondent is looking for, in which direction, and how much AI they want in their next job. Students were also asked the chance of finding a job within six months.
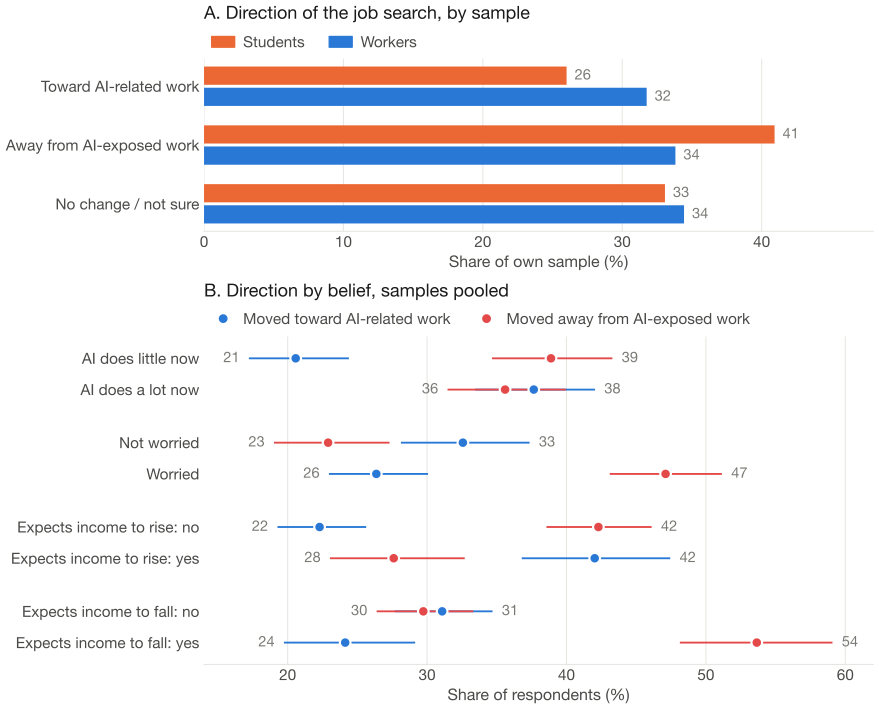
Exhibit 3: Two-thirds have redirected their search; experience and expected gains pull toward AI work, worry pushes away. Panel A: how AI has changed the kind of job people are looking for, by sample. Panel B: pooling both samples, the share who moved toward AI-related work (blue) and away from AI-exposed work (red), split by four beliefs. Whiskers are 95% confidence intervals.
Most people say they have already moved. Two-thirds of students and two-thirds of workers say AI has changed the kind of job they are looking for. Among students the movement runs mostly away from exposed work: 41% now want a job AI cannot easily take, and 26% want AI-related work. Workers split evenly. A May 2026 survey of China’s class of 2026 found even more movement, with nine in ten graduates saying they had adjusted their plans.6
The trade-offs people state are real on both sides. One in five in each sample would accept lower pay to enter AI-exposed work. Pulling the other way, half of students and two in five workers would demand at least a 50% premium to take an AI-exposed job over a safe one, or would refuse it at any price.7
Who runs toward AI and who runs away? A belief about AI has two parts, one about the technology and one about oneself, and they need not agree. A programmer can believe AI will do most of her tasks and expect a raise; a driver can believe it will do few of his and fear for his job. Three patterns stand out.8
Experience with AI pulls toward AI. People who say AI already does a sizable part of their job are almost twice as likely to have moved toward AI work as those who say it does little, and no more likely to have moved away. Worry pushes away. People who are at least somewhat worried are twice as likely to have moved away from exposed work, and they are less willing to take a pay cut for AI-exposed work or to pay for training. Expected pay sorts the movers. Among the 650 people who changed direction, those who expect AI to raise their pay went toward it and those who expect a cut went away, and this is the belief that separates the two directions most cleanly.
The expected chance of being replaced, the number Section 1 led with, sorts no one. It predicts moving at all, in either direction, and those who moved toward AI work and those who moved away put their five-year chance at the same 39%. What a high replacement chance produces is activity, not a direction. For students, these beliefs also affect the search itself. Those who put their replacement chance in the top third expect a 65% chance of a job within six months, against 74% for the bottom third.
4. Almost everyone would train for free; demand falls steeply with price
Retraining is the most popular policy answer to AI. The evidence on it is about supply. A review published by Anthropic in August 2026 finds that across 56 randomized U.S. trials, being offered training raised employment by about two points and earnings by about $800 a year, against a cost of about $13,600 per person. I asked about demand. Would you enroll in a 20-hour AI skills course if it were free? At ¥300? At ¥800? What is the most you would pay?
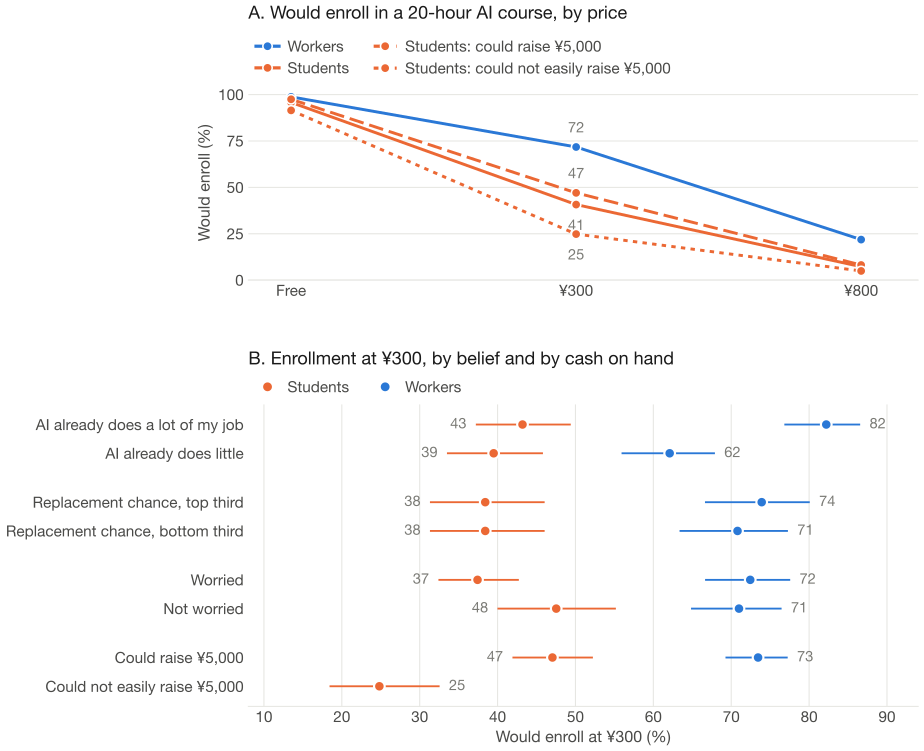
Exhibit 4: Almost everyone would take a free AI course; at ¥300 demand halves among students, and cash on hand and experience with AI decide who stays. Panel A: share who would enroll in a 20-hour AI skills course at each price, with students split by whether they could easily raise ¥5,000 within a week. Panel B: enrollment at ¥300 by four splits of each sample. Whiskers are 95% confidence intervals; only 18 workers are cash-constrained, so that split is not shown for workers.
Free, almost everyone says yes. At ¥300, about US$44, 72% of workers still would, but only 41% of students. At ¥800, about US$117, 22% of workers and 7% of students. The median worker would pay about ¥470 for the course, roughly 5 to 7% of a month’s pay in the median income band; the median student, ¥200. These are hypothetical amounts, and stated willingness to pay typically overstates real payment, so the levels are upper bounds: real demand at ¥800 would be lower still.9
Cash on hand decides who drops out first. Students who could not easily raise ¥5,000 within a week enroll at ¥300 at half the rate of those who could, 25% against 47%. About half of that gap is education, income, rural origin, city, and province; the other half remains once all of those are held constant.
Having seen AI at work predicts buying training; fearing it does not. Workers who say AI already does a sizable part of their job are 20 points more likely to enroll at ¥300 than those who say it does little, and would pay about ¥300 more; both gaps survive holding income and cash constant. That is the experience channel of Section 3 again, though among students the same contrast is small. Perceived risk, by contrast, does not predict demand. Students who put their replacement chance in the top third enroll at ¥300 at the same rate as those in the bottom third, 38% in both groups, and the same holds for workers.
The demand side of retraining, then, has the wrong shape for the people policy most wants to reach. Those short of cash leave first, those who have already seen AI at work are the buyers, and the frightened are not, as far as the pilot can tell.10 What to watch is whether subsidized training reaches the constrained group, and whether a first experience with AI on the job, the one thing that predicts demand here, can be provided rather than waited for.
5. Women students want less AI in their next job and would pay less to learn it
Women students hold beliefs statistically indistinguishable from men’s but state different choices. On the task count, the replacement chance, and worry, the two groups do not differ. Yet women want about half a job less AI among the ten they would next apply to, and are 12 points less likely to enroll at ¥300. They would pay about ¥125 less for the course, and put their chance of a job within six months 6 points lower. Holding beliefs constant shrinks these gaps only by a fraction. Holding the target occupation constant shrinks them further, so part of the gap runs through which occupations women aim at.11 Anthropic reports a related pattern among its users in Cadences, where women use Claude for coding and automation less than men in the same occupations.
6. Workers’ beliefs move with their own AI use, more than with any exposure index
If beliefs were formed by looking at one’s occupation and reasoning about what language models can do, they would rise with the exposure indices economists have built for that purpose. I attached eight such indices to each respondent’s occupation, coded from the job title they typed. They are the Eloundou task rating, the two Felten indices, Webb’s patent-based AI, software, and robot scores, Anthropic’s observed-exposure measure of the tasks Claude is actually used for, and an index built from Chinese job postings that I helped construct.12
For workers, none of the eight predicts the five-year replacement chance, the expected task share, or worry. A worker in an occupation one standard deviation higher on the Eloundou index puts the five-year chance only about 2 points higher; the same comparison among students gives 5 points. For about half of the eight indices the difference between the samples is larger than chance would produce.13
What does predict a worker’s expectation is the answer to a simpler question: how much of your job AI already does. Workers who say AI already does most of their tasks put the five-year chance at 39%; those who say a few tasks, at 31%. Panel A of Exhibit 5 shows the gradient. And that answer, for workers, is not a property of the occupation. It varies no more across the 58 occupation groups in the sample than chance would produce, it is unrelated to all eight indices, and it tracks how often the worker uses AI at work. Among students it does vary by target occupation, and it rises with six of the eight indices.
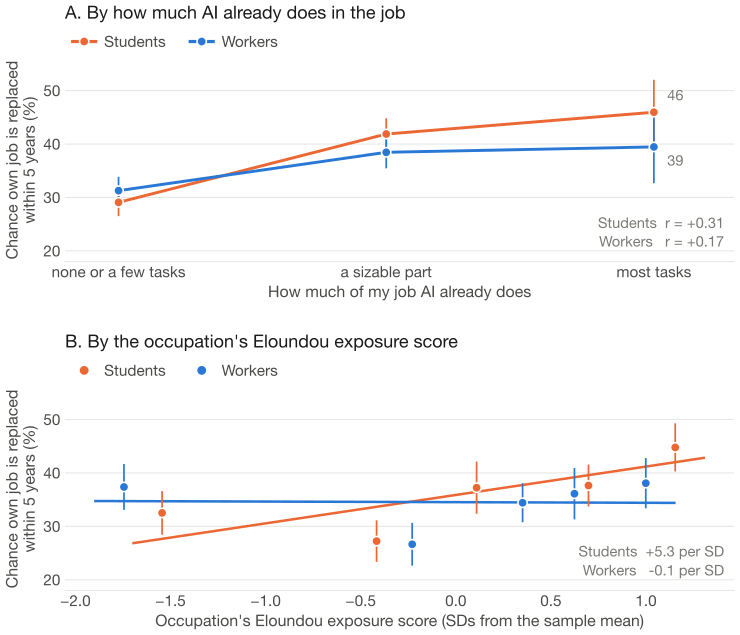
Exhibit 5: Workers’ replacement expectations track what AI already does in their own job, not their occupation’s exposure score; students’ track both. Mean stated percent chance that AI replaces one’s own job within five years, by how much of the job AI already does (panel A) and by fifth of the Eloundou-style exposure score of the coded occupation, plotted at each fifth’s mean score with the individual-level fit line (panel B). Whiskers are 95% confidence intervals.
So the honest version of the contrast is this. Workers’ expectations move with their own use of AI; students’ expectations move with the reputation of the occupation they name. Two things qualify it. The samples occupy different parts of the occupation space, and inside the part they share, mostly professional and technical work, workers’ beliefs do rise with the Eloundou index at about the students’ rate, and less clearly with the other indices. Outside it, neither sample’s beliefs track any index. And two-thirds of students have already redirected their search, so the occupation their index is attached to was chosen partly on the belief being predicted. Occupation still matters to workers: their occupation groups jointly predict their replacement chances, but what they predict does not line up with what any index says.
This is where the pilot departs from what has been found among AI users. Anthropic’s 81,000-person interview study found mentions of a threat to one’s own job rising with observed exposure, and its Economic Index Survey found the share of tasks users say AI can do rising with exposure. The second pattern holds here for students and not for workers; the first holds for neither. Part of the difference is population: Anthropic’s respondents are concentrated in computing and management, and physical occupations, nearly absent there, are where the divergence sits. Part may be that Anthropic’s outcomes describe the present, while the chances here are forecasts.14
Discussion
Young Chinese workers and students expect a lot from AI, and soon, but they expect their jobs to change rather than end. What they do about it follows their own experience and pay expectations more than their sense of risk, and workers’ expectations follow what AI already does at their desk rather than any index built for their occupation.
Set beside the existing surveys, the pilot adds three things and departs on one. It asks for probabilities at several horizons rather than a likelihood category, which is what Gallup, Ipsos, Pew, and the OECD collect.15 It sets beliefs beside eight exposure indices outside the AI user base. And it prices training demand. The departure is Section 6: among Claude users, Anthropic finds beliefs rising with observed exposure; among these workers they do not.
The limits are real. The sample is about a thousand respondents from an online panel with soft quotas, heavy on professionals and light on farmers and factory workers. The probabilities were unincentivized. Every behavior is stated, and every belief and behavior comes from the same sitting, so the links are associations whose direction is open: someone who has moved toward AI work may describe the job as more AI-touched. With 500 people per group, the nulls are bounded rather than tight.
Suggested citation. Hang Yu, “Perceived Exposure: A Pilot Report — What Young People in China Expect AI to Do to Their Jobs,” September 2026, https://econhangyu.com/reports/ai-perception/.
Notes
Anthropic’s Economic Index Survey (Cadences, Chapter 3) and its 81,000-person interview study pair beliefs with observed Claude usage, but their respondents are Claude users; about 30% work in computing and physical occupations are nearly absent. The one China study with an experimental design is Menghan Shen, Qianyi Xiao, Xin Chen, Shixin Fang, and Kinglun Ngok, “Generative AI, Perceived Job Displacement, and Policy Preferences: Experimental Evidence from China,” Journal of Economic Behavior and Organization 246 (2026): 107535, https://doi.org/10.1016/j.jebo.2026.107535, with 758 white-collar workers in Guangzhou. ↩
Two in five of those at 50% or higher answered exactly 50, which on an open scale reads as “I don’t know” as much as a forecast; only one in ten puts the chance at 70% or higher. Appendix C. ↩
The result survives controls for AI use, education, occupation, numeracy, and time spent on the survey, so it is not inattention. Among students the same gap is a third of a task and could be zero. Appendix C. ↩
Students are 70% female and 28% cannot easily raise ¥5,000; with those and the other controls held constant, students remain 12 points more likely to be worried and 11 points less likely to expect a raise. Appendix F. ↩
The Anthropic figures are from Figure 2 and its accompanying text in the interview study and Figure 3.6 of Cadences. The student figure is from a 2025 survey of 3,129 university students by China Youth Daily, 中青校媒, and Soul App, as reported on the newspaper’s site, where it appears in a graphic. ↩
1,333 graduates surveyed by China Youth Daily’s survey center with the panel vendor Wenjuan.com. ↩
The item offers premium thresholds of 20% and 50% and a “refuse at any price” endpoint, chosen by one in ten in each sample. In a Swiss survey experiment, respondents choosing for a hypothetical 40-year-old child gave up about a fifth of the median wage for ten points less automation risk (Maria A. Cattaneo, Christian Gschwendt, and Stefan C. Wolter, “How Scary Is the Risk of Automation? Evidence from a Large-Scale Survey Experiment,” Journal of Economic Behavior and Organization 235 (2025): 107034, https://doi.org/10.1016/j.jebo.2025.107034); the differentials stated here are not obviously out of line with that. ↩
Every belief was checked against every stated behavior, holding occupation and background constant; the full matrix, and the direction-of-movement analysis among those who changed course, are in Appendix D. ↩
A meta-analysis of 28 studies puts the median ratio of hypothetical to actual value at about 1.35 (James J. Murphy, P. Geoffrey Allen, Thomas H. Stevens, and Darryl Weatherhead, “A Meta-Analysis of Hypothetical Bias in Stated Preference Valuation,” Environmental and Resource Economics 30, no. 3 (2005): 313–25, https://doi.org/10.1007/s10640-004-3332-z). ↩
The New York Fed’s survey of U.S. consumers found something similar from the other side: among workers without employer AI training, the median value placed on access to it was zero, though the mean was 11% of salary. ↩
This is a student result. Among workers the same gaps are smaller and none is distinguishable from zero, though the pilot cannot tell the two samples’ gaps apart. Appendix D3 gives all eleven comparisons and the smallest gap the pilot could detect. ↩
Job titles were coded to detailed occupations by a language model; a second model, blind to the first, agreed on 80% of detailed codes (Appendix E). The indices: Tyna Eloundou, Sam Manning, Pamela Mishkin, and Daniel Rock, “GPTs Are GPTs: Labor Market Impact Potential of LLMs,” Science 384, no. 6702 (2024): 1306–8, https://doi.org/10.1126/science.adj0998; Edward Felten, Manav Raj, and Robert Seamans, “Occupational, Industry, and Geographic Exposure to Artificial Intelligence,” Strategic Management Journal 42, no. 12 (2021): 2195–2217, https://doi.org/10.1002/smj.3286, and “How Will Language Modelers like ChatGPT Affect Occupations and Industries?,” arXiv:2303.01157 (2023); Michael Webb, “The Impact of Artificial Intelligence on the Labor Market,” SSRN 3482150 (2020), https://ssrn.com/abstract=3482150; 张丹丹、于航、李力行、胡佳胤、莫怡青、李泓孛, 《中国人工智能技术暴露度的测算及其对劳动需求的影响——基于大语言模型的新证据》, 《管理世界》2025年第7期, 59–72, https://doi.org/10.19744/j.cnki.11-1235/f.2025.0092, of which I am a coauthor. Anthropic’s measure is time-weighted, gated on the Eloundou rating, and counts augmenting use at half weight, so it is not a plain share of tasks. ↩
Appendix F reports all eight indices and three outcomes, with and without controls, with standard errors clustered by occupation group, which changes no conclusion. The worker slope could be zero; the pilot rules out a worker slope larger than about 4 points, not a small one. The count of distinguishable differences is four or five of eight, depending on how the index is scaled. ↩
Figure 1 of the interview study; Figures 3.3 and 3.5 of Cadences. Two smaller patterns match Anthropic’s: respondents rate the threat to people like them above the threat to themselves, and the expected increment of AI progress across horizons is similar across exposure quartiles. Appendix C. ↩
The OECD’s 2022 surveys of finance and manufacturing workers asked how worried respondents were about losing their job to AI within two and ten years (Marguerita Lane, Morgan Williams, and Stijn Broecke, The Impact of AI on the Workplace: Main Findings from the OECD AI Surveys of Employers and Workers, OECD Social, Employment and Migration Working Papers 288 (2023), https://doi.org/10.1787/ea0a0fe1-en). Pew asked U.S. workers whether they were worried (52%) and whether AI would bring fewer opportunities (32%). Appendix G. ↩